February 14, 2022
Findings from Cleerly’s groundbreaking echo the recent American College of Cardiology guidelines on the use of CCTA for non-invasive heart disease evaluation.
Instead of proactively identifying patients at risk of heart disease, our industry has historically treated patients once symptoms appear, which can result in late or missed diagnoses, as well as unnecessary referrals to catheterization laboratories.
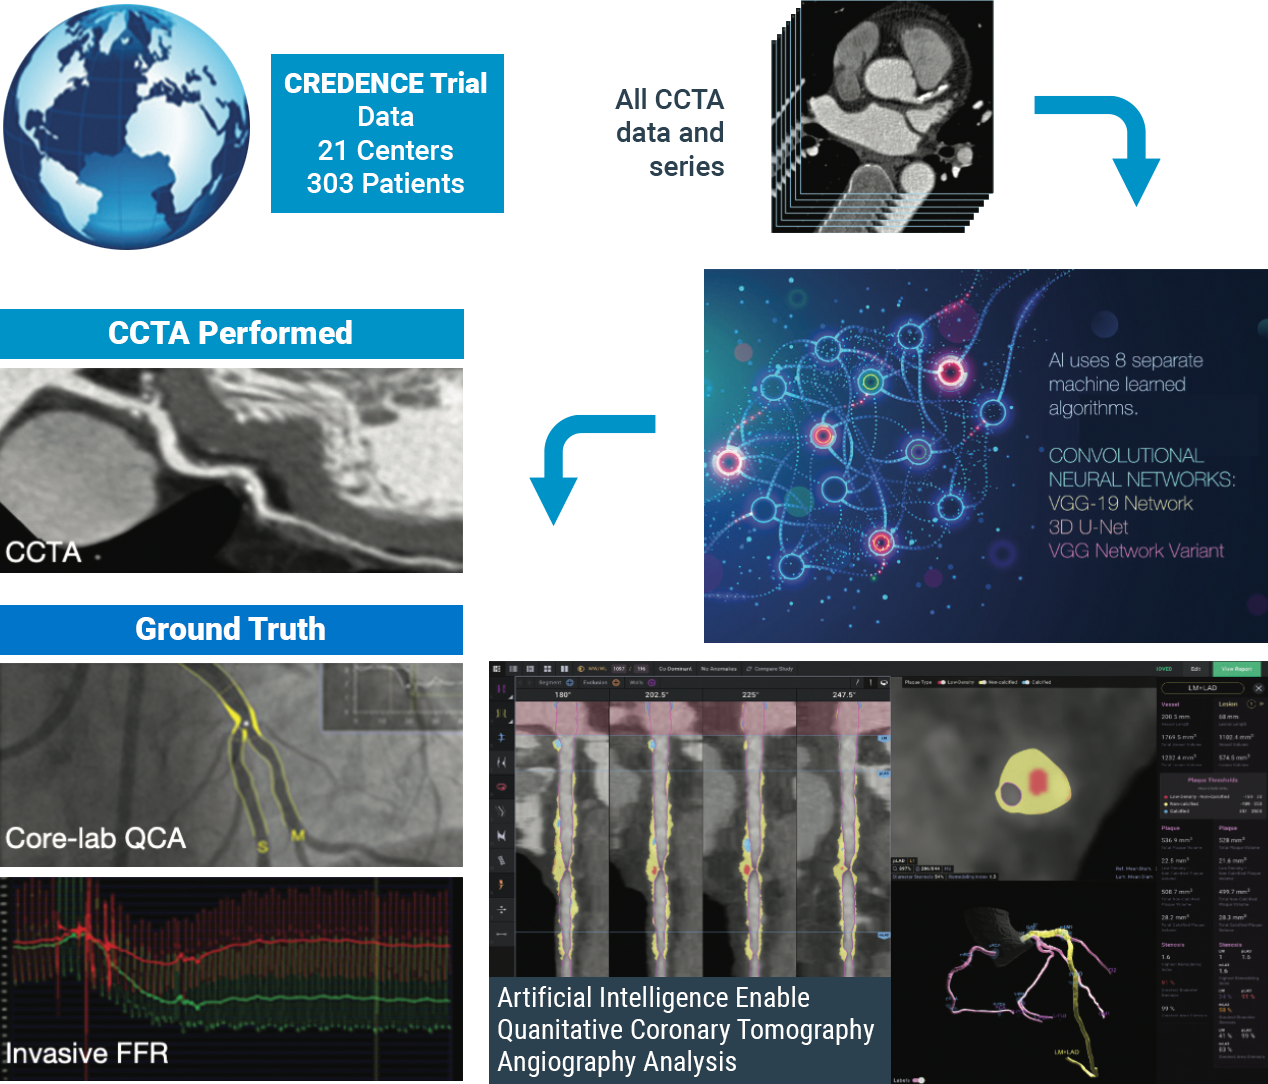
The CLARIFY 2 study, the second of six studies comparing Cleerly analysis against current gold standards to plaque and coronary artery imaging, demonstrates Cleerly’s effectiveness in the identification and exclusion of high-grade stenosis against traditional core-lab interpreted quantitative coronary angiography (QCA) and invasive fractional flow reserve (FFR) methods. The findings in this study echo the recent American College of Cardiology guidelines on the use of CCTA for non-invasive heart disease evaluation.
AI-Based Evaluation of Coronary Artery Stenosis on Coronary CTA Demonstrated High Accuracy to Core Lab-Interpreted QCA and Invasive FFR
Study highlights include:
Cleerly’s identification and characterization of stenosis is highly accurate (>90% sensitive and highly specific)
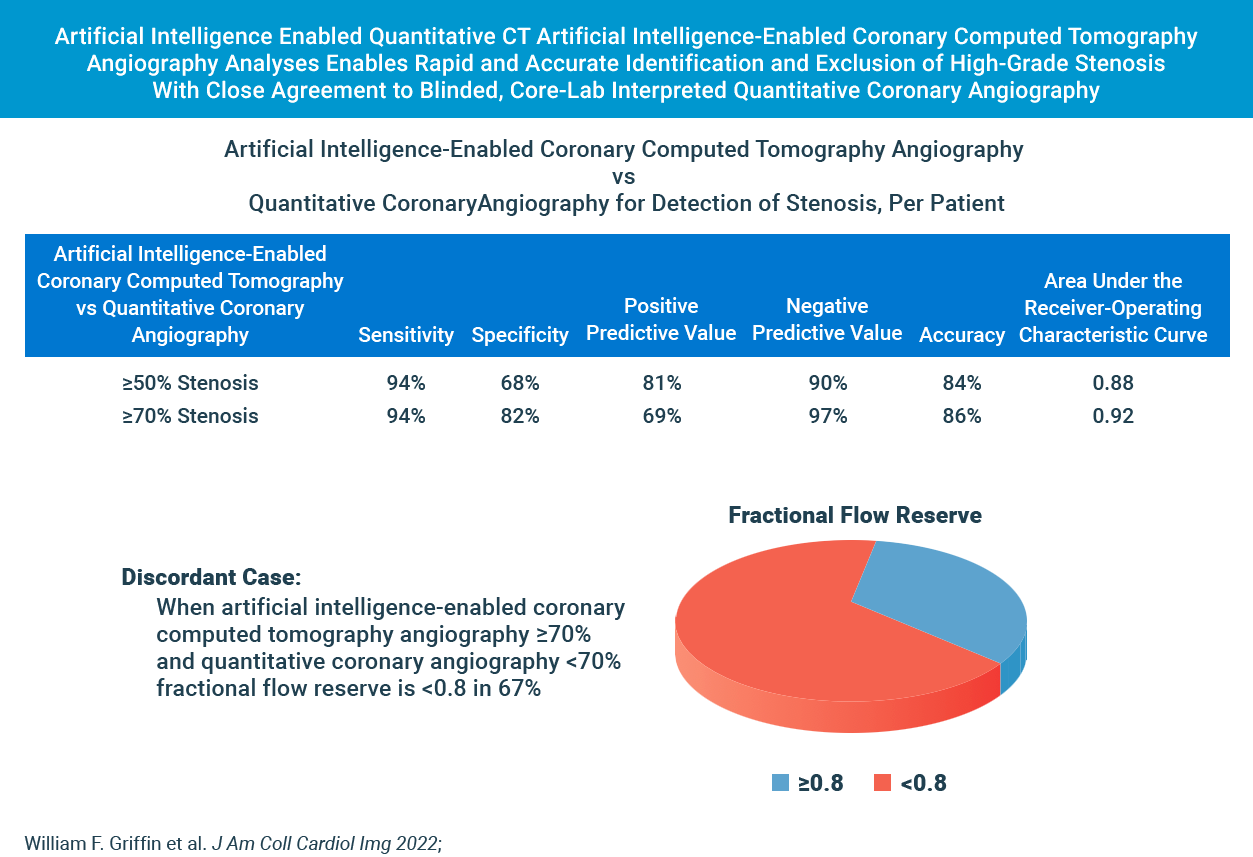
Study findings show high diagnostic performance of Cleerly’s non-invasive AI-based evaluation for moderate and severe stenosis at both the ≥50% and ≥70% occlusion levels, along with high correlation to invasive QCA. Importantly, the diagnostic performance of Cleerly’s analysis is similar to results in prior multicenter clinical trials being referred for ACC guideline-indicated invasive coronary angiography.
cleerly’s diagnostic performance for moderate and severe stenosis is strong
Cleerly’s AI-based evaluation level of precision is strong based on the area under the receiver-operator characteristic curve (AUC), used to evaluate the diagnostic performance as well as to evaluate the prediction of FFR for both QCA and AI-based CCTA.
The higher the AUC results, the better the model is at distinguishing between patients with disease and no disease. The per-patient AUC is 0.88 for ≥50% moderate stenosis and 0.92 for ≥70% severe stenosis threshold, and a per-vessel AUC of 0.90 for ≥50% moderate stenosis and of 0.95 for ≥70% severe stenosis.
While these scores are numerically higher than those observed by expert core lab readers (AUC: 0.69) and site readers (AUC: 0.57) in the multicenter randomized PROMISE trial, AI-based evaluation for moderate and severe stenosis is significant.
These combined data points offer compelling evidence that clinical use of Cleerly’s AI-based CCTA evaluation serves as an important and useful standard of care for coronary CT interpretation.
| Method | Stenosis | Basis | Sensitivity (95% CI) (%) |
Specificity (95% CI) (%) |
PPV (95% CI) (%) |
NPV (95% CI) (%) |
Accuracy (95% CI) (%) |
AUC (95% CI) (%) |
|---|---|---|---|---|---|---|---|---|
| AI-QCT | ≥50% | Per territory (n = 909) Per patient (n = 303) |
91 (87.1-94.2) 94 (89.8-97.0) |
84 (79.6-86.1) 68 (59.7-75.8) |
69 (64.1-74.4) 81 (74.7-85.5) |
96 (93.8-97.3) 90 (87.2-94.4) |
86 (83.2-88.1) 84 (78.8-87.3) |
0.90 (0.881-0.926) 0.88 (0.843-0.923) |
| QCA | ≥70% | Per territory (n = 909) Per patient (n = 303) |
90 (83.3-94.4) 94 (87.3-97.9) |
91 (88.0-92.8) 82 (76.4-86.8) |
58 (51.0-66.3) 69 (60.5-76.6) |
99 (97.3-99.2) 97 (93.5-99.0) |
91 (88.5-92.8) 86 (81.4-89.3) |
0.95 (0.940-0.966) 0.92 (0.893-0.950) |
| Subgroups based on detection of ≥50% stenosis. AI-QCT = artificial intelligence-enabled computed tomography angiography; AUC = area under the receiver-operating characteristic curve; NPV = negative predictive value; PPV = positive predictive value; QCA = quantitative coronary angiography. |
||||||||
In Cases Where Cleerly and Invasive Angiography Results Disagree, FFR Agrees With Cleerly Over Angiography ⅔ of the Time
The study provides evidence that Cleerly analysis may have performed better than the QCA gold standard used. In the 62 vessels that Cleerly’s estimate of stenosis differed significantly from QCA, we used the “ultimate” gold standard of invasive fractional flow reserve (FFR) to adjudicate the difference. In more than ⅔ of these discordant cases, the FFR result agreed with Cleerly’s output and not QCA.
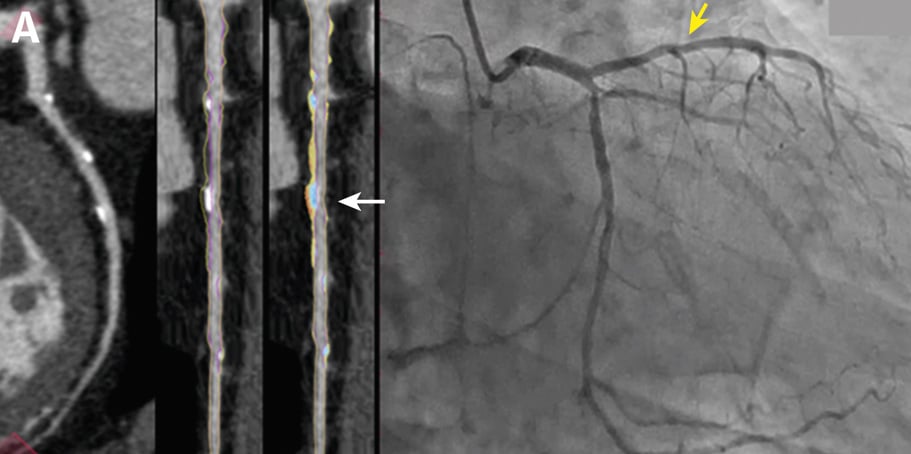
Curved multiplanar reformatted image (MPR) (left), and straightened MPR (second from left) with the lumen boundary (purple line) and outer vessel wall boundary (yellow line) overlay, and with color plaque overlay (second from right) (red is low-density noncalcified plaque [<30 HUs], yellow is noncalcified plaque [31-350 HU], and blue is calcified plaque [>350 HU]). AI depicted a 60% stenosis (white arrow) in the proximal vessel segment. (Right) The left coronary invasive angiogram, in which QCA analysis depicted no stenosis (yellow arrow).
CLARIFY 2 Takeaways
Cleerly’s CLARIFY 2 study aligns with ACC CCTA guidelines and affirms Cleerly’s value over invasive QCA and FFR methods for non-invasive heart disease evaluation. With more than 62% of referrals to catheterization laboratories being unnecessary, cardiac care needs to shift away from treating symptoms and referring patients to the catheterization lab for unnecessary procedures, and focus on preventing heart disease in the first place.
Stay tuned for upcoming results from subsequent CLARIFY studies on the comparison of Cleerly outputs against other gold standards for plaque and coronary artery disease evaluation.
At Cleerly, we focus on identifying patients at risk sooner, quantifying and characterizing disease, enabling personalized and preventive treatment, and improving clinical outcomes that yield significant cost savings for patients and providers.